Starting Guide

Quick Start
Get to your own business plan - in just 3 minutes!
Create your business plan
First log in with your account. Click "Create business plan". Give your project a name and a start date (they can be changed later).
Write some text
Open your new business plan and click "Edit". Write a sentence in the text box. If you feel like it, add a picture. The first step is made!
Save your PDF
Click "Print" at the top of the main menu and get your business plan as a PDF. Now go ahead – start writing. Good luck!
Starting Guide
Welcome to SmartBusinessPlan
And welcome to the guideline to get you started on working with the Web-App!
Writing a business plan is not science. Our web application neither. Take ten minutes and check out this guide for our business plan software. Then you can get started on writing your own business plan.
This Guide for Smart Business Plan will teach you the first steps:
• creating a business plan
• editing chapters
• entering numbers with the wizard
• the exporting as a PDF file.
Some words are linked to our knowledge base. If you still have questions, take a look at our FAQ or contact our Support. The web app has examples for real business plans to give you an idea how to get going.
Now let’s get started!
Create a Business Plan
After logging in you find yourself on the overview page. This is the control center of SmartBusinessPlan. Here you see your content, our examples and can change your information or purchase a license in the account area. Click on the button to create a new business plan.
Give your project a name and a starting date. Starting this month, your plan provides a 3-year overview revenue, expenditures and profit. August 2014 is the starting date in our example:
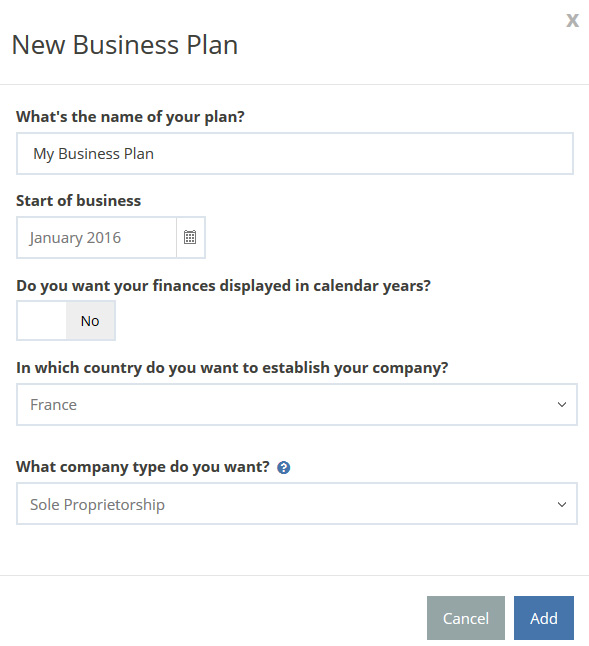
You can display time either in calendar years or business years. Switching is possible whenever you want. Last but not least you have to decide on a legal form for your company. This only affects the display of private withdrawals: No personal drawings will be planned for a corporation. If you’re not sure you can choose “I don’t know yet”. Your plan will be displayed now. You will encounter the little blue question mark button frequently: It provides you with a short info about the topic via tooltip and usually links to the glossary.
Click “Add” to create your new business plan.
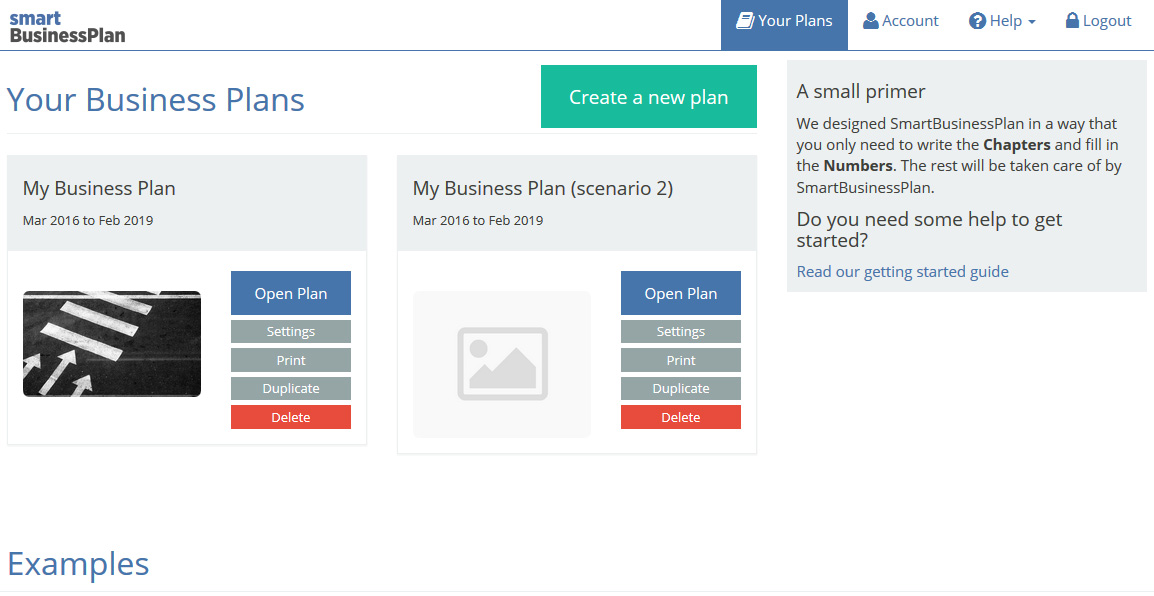
From now on you will find your plan on the page “Your Business Plans”. Beneath the name of your plan you can see the time-period its set in.
Text, Pictures, Charts
Since we want to get writing, let’s take a look at the writing area. Open your business plan.
Interface
On the left side you can find the chapters. To the right of the chapters you will see your input. Let’s see what the upper toolbar can do.

- Business Plan: This is where you work on your business plan by writing text and adding numbers, pictures and charts.
- Settings: Here you can customize your chapter overview or change the name and starting date of your business plan.
- Print Preview: Shows you a preview of all the chapters. This way you can see your progress without creating a PDF.
- Print: Prompts the printing menu and our favorite button Print as PDF.
- Help: Contains links for our glossary, the FAQ and this starting-guide. Takes you to our support and feedback page.
- Close: Click here to return to the overview page.
You can find options for your business plan content at the bottom panel. We will take a closer look at those functions.

Add Text
Adds a new text box at the end of the chapter. You can position it with the sorting function. Every chapter can have multiple text boxes. The first text box is pre-created. Its text states "Click on the button to the right and get going…” Click Edit and start writing. You can format your text using the usual methods e.g. making words bold or adding a bullet list. Once you are done with your text click Save.

Add Picture
Opens a dialog box that allows you to add an image file, from your PC (JPG or PNG), into the chapter. Once inserted, you can replace it with another image or edit the caption by pressing Edit. Otherwise the filename is used as the caption.
Press Save to exit the editing mode.
Add chart
Opens the Chart Wizard. With a chart, you can visualize the following data:
• Revenue
• Human resources
• Operating expenses
• Profitability
• Liquidity
• Capital requirements.
Since you haven’t added any data into the financial plan, the charts are empty. If you want to test it anyway: Click Add Chart and select one of the records that you want to display. You can choose between months and years as a time format. If you chose months as a format, you can also detail the time frame even more e.g. only the first year or months 24-36. After creating the chart, you can use the button Settings to choose between two display modes: line or bar charts. The chart for capital requirements always appears as a pie chart.

Add Table
The button Add Table opens an ascending menu, which lets you choose out of a variety of financial tables. This function provides you with detailed tables in which you can your financial data. Single columns can be edited (pen symbol) or deleted (trash can symbol). You can also add columns by pressing the corresponding Add ……… button.
Add Page Break
Adds a page break at the end of the chapter, which finishes the page when you print your plan. You can place the page break anywhere in your chapter by using the button Sort the chapter.
Sort the chapter
Opens a window, which lets you sort all content in the chapter. You can rearrange text boxes, pictures, chart etc. to your liking. You can learn more about this feature here.
The financial Plan
The financial section includes all facets of the chapter “Finances”. We simplify your work with our Input Wizard. In your business plan, switch to the chapter revenue by using the chapter overview. If you are on your “Your Business Plans” page, open your business plan and switch to the chapter Revenue. For this starting guide we are going to take an exemplary look at one of our wizards: the sales wizard. Take a look at the sub-chapter Sales in the chapter. Let us enter a product! Click the button Edit and then on Add Revenue Position.
Now you can create a sample product. In the screenshot, we place a “standard product of the finest quality”. A VAT rate of 20% is selected. You know the VAT from your shopping receipt: bread is taxed with 0%, but non-food products usually with 20%. You can learn more about that in our glossary.
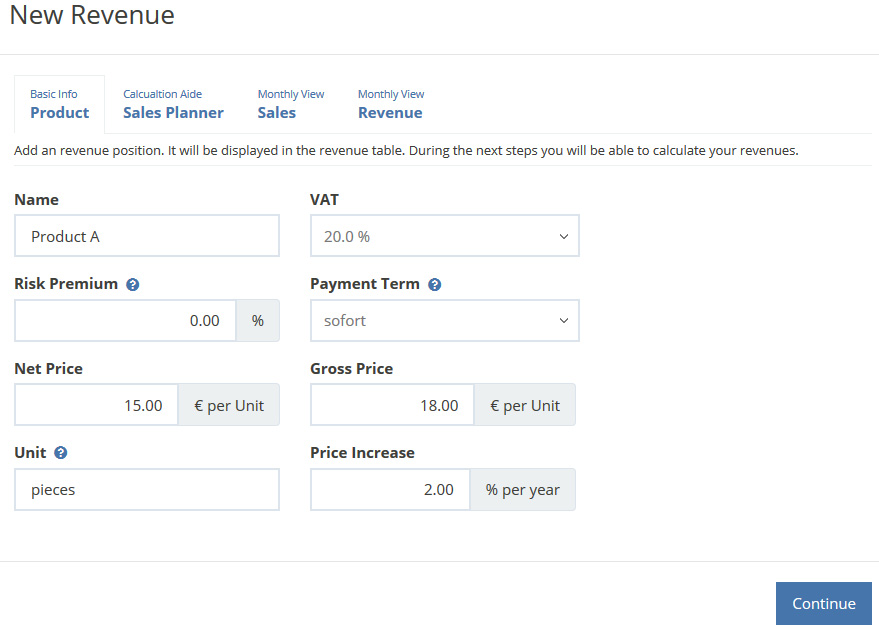
At the top you can see 4 tabs. All our wizards follow this layout. By pressing Continue you go through all the tabs, one by one.
In the tab Sales Planner you add your suspected sales development:
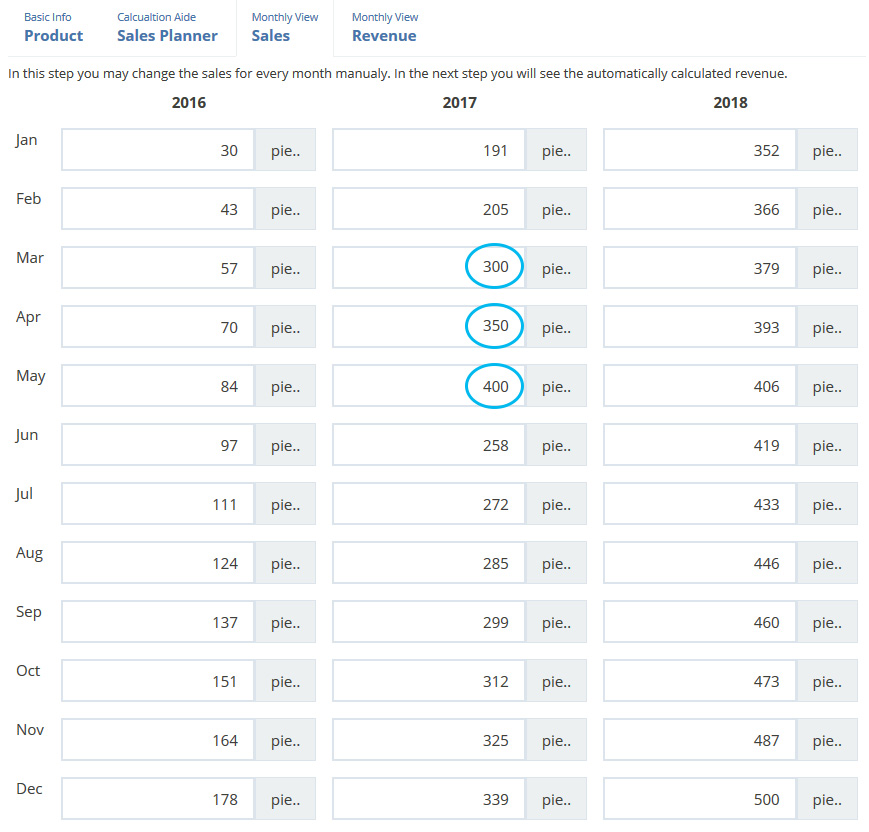
The next tab Sales will show you monthly sales projection for the time frame you set. Same can be said for the last tab Revenue, only it shows revenue instead of sales.
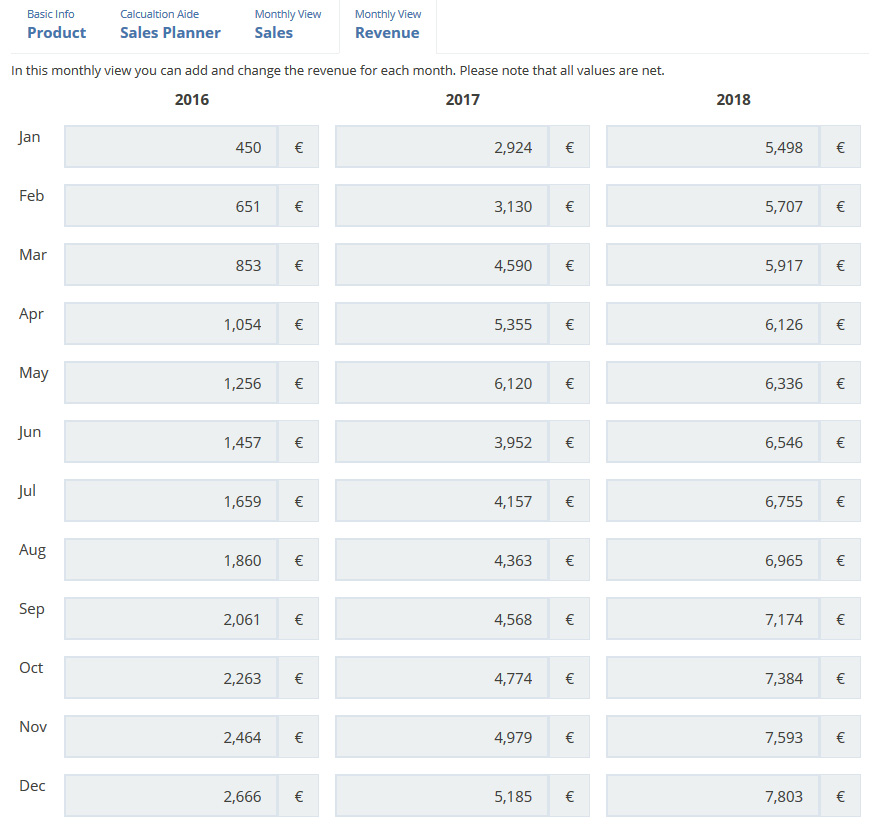
The blue circles are placed to show you where figures were edited. In our example, a drop in sales is predicted for the months November and February – the revenue in these months is 300 EUR. Such revenue fluctuations are quite normal for a lot of products. For example, the ice cream sales depend on the season. In order to account for such variations, you can manually edit the automatically completed sales table. Click any month and change the value. That is how we changed those revenues to €300. These changes will be pointed out elsewhere. In the tab sales planner you will see this warning:

Click Finish and your product or service will appear in the table. Use the buttons to edit or delete positions in your table. They can be found at the end of every position.
The sales wizard was our example for the usage of our wizards. In addition to your sales you have to add several more sets of data (e.g. monthly costs, investment, founding costs etc. – their assistants have similar functionality. Once you added all your data, the next part will be especially interesting for you.
The Automatism
Now we are going to have a look at the chapters Profitability and Liquidity. Even adding a little data, leads to a comprehensive overview.
The table Profitability shows you whether your plan is economically viable: Do you manage to immediately make a profit (black figures) or do you lose money (red figures)? The table liquidity will show you how your cash-flow is developing: Will you always able to pay? The year-overview provides you an initial overview. But you should also check the monthly view in the PDF attachment (see next chapter).
No financial plan is perfect from the start. If you recognize bottlenecks, you should critically examine your information in the previous chapters: Perhaps one part-time employee is enough for the first year? Could you use high-quality second hand equipment instead of new equipment? But be careful! All customisations that you undertake should be well-founded. There is no point in simply increasing revenue or funding capital. Unrealistic approaches are quickly spotted by investors and will have consequences for market entry.
PDF-Printing
Once you wrote a few sentences and added a few numbers, take a look at the PDF-printing. The main goal of your effort should be to have your business plan in an attractive format. Click Print in the top menu.
You will see a preview of the layout and the printing setting. Click Print as PDF to add all your texts, pictures, charts and tables into a file you can save on your PC.

Get going!
You completed our starting guide. Now you know how to write your business plan. Get started and realize your vision.
If you have any questions, visit our Glossary.
Good Luck!
